
Interesting Charts and Quotes - June Edition
Dear Friends,
Thank you to those of you who attended our summer cocktails event this week. It was great seeing those who could make it. Below we share a few charts to provide some context and color for what we are observing in the market.
In this edition, we review:
- How have companies that reported earnings more recently traded?
- What does zooming out on long term market index trends imply?
- Are there opportunities in small caps?
How have recent reporters performed? - We take a look at US Retailers who reported in May
- We note that the Retailers Index has outperformed the S&P 500 since reporting Q1 results in May.
- These retail companies have a later reporting schedule than the rest of the S&P 500 and hence were more able to reflect the inflation pressures of fuel, freight and labor we've seen recently.
- On average the top 10 companies in this sector reduced their annual Earnings Per Share (EPS) guidance by over -15%.
- Despite that reduction, the Retailers Index is up about +1% since mid May when they reported outperforming the S&P 500 by over +5%.
- We believe this suggests some of the inflation impact may have already been priced in to the market.
- Also, certainty can often be good for the market, even if it represents fundamentals initial expectations.

What are the long term trends of the S&P 500?
- Based on a statistical best-fit trendline model, we note that the S&P 500 has recently pulled back to levels slightly below to in line with its long term expected return range.
- For more detail, in the summer of 2018 the market traded at approximately 2800. The long term average returns for US equities is 7-10%. If you assume a 7-10% return per year for the S&P 500 since 2018, the S&P 500 is currently in line with this range of ~3600-4000.
- While the volatility isn't fun, the good news from here is that statistics would suggest a positive return over the next 12 months from here.
- Of course, these are just statistics and the market can be affected by drastic changes in economics, war, or even public policy (think tax rates). However, we find it helpful to take a long term view at times.

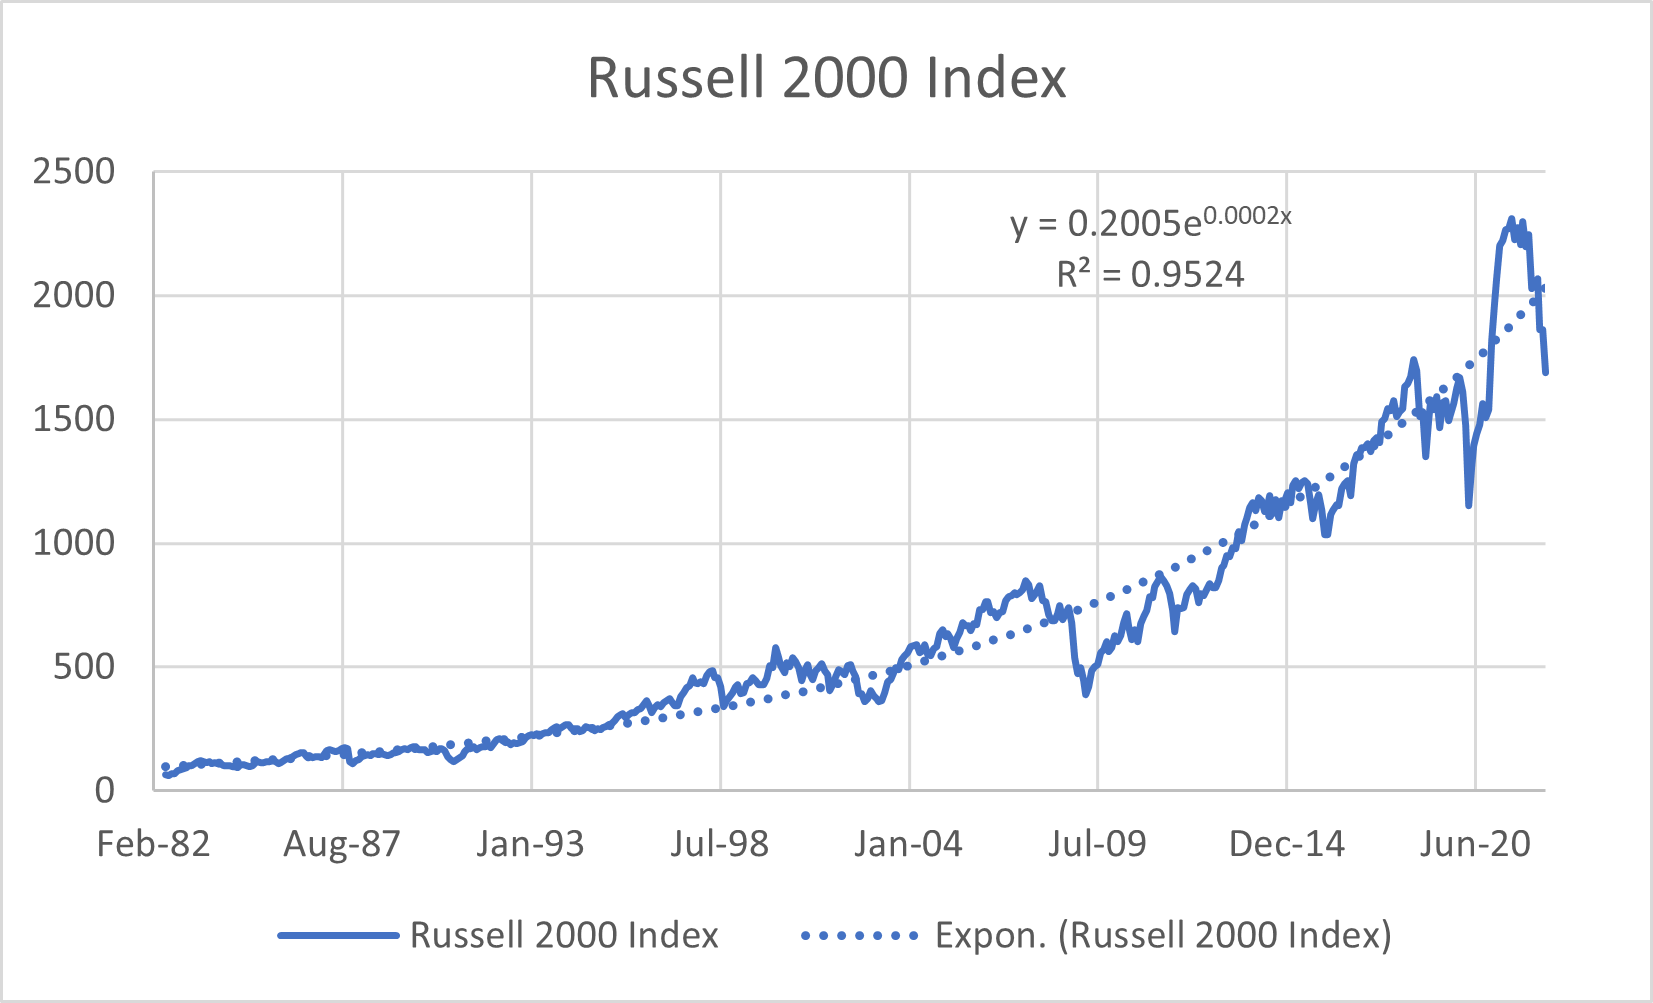
Are there opportunities in Small Cap? - Yes, we believe!
- After the recent sell-off, the Russell 2000 index has now traded back to levels flat with 2018 over 4 years ago.
- We believe small and medium sized companies generally create meaningful innovation and economic development for our economy.
- We feel this entry point could be attractive for long-term minded investors.
- Look to our newsletter for more detail on targeted opportunities, which is the best way to invest in small cap.
Source: All market data per Bloomberg as of 6/22/22; Retailer Index represented by RTH; Earnings and Cash Flow Yields based on company results and The Bycoff Group estimates.